 kasploosh.com
Show Territories
2012-06-12

Show Territories GUI
This is a simple function that takes advantage of the image-creating code to create a color-coded graphic showing where one animal is in relation to others. It uses a simple polygon method to describe the territory of each cat. The GUI makes it easy to change the date range, or select different cats.
This feature is not useful for scientific study, because the model of a territory is too simplistic. But it remains useful for auditioning the data that is available in a data set, and testing arguments that you are using with other functions. This gives you immediate visual feedback about what data is available in the set.
Output
This function of the program creates image output.

Example image output from Show Territories
Click to enlarge
Screenshot
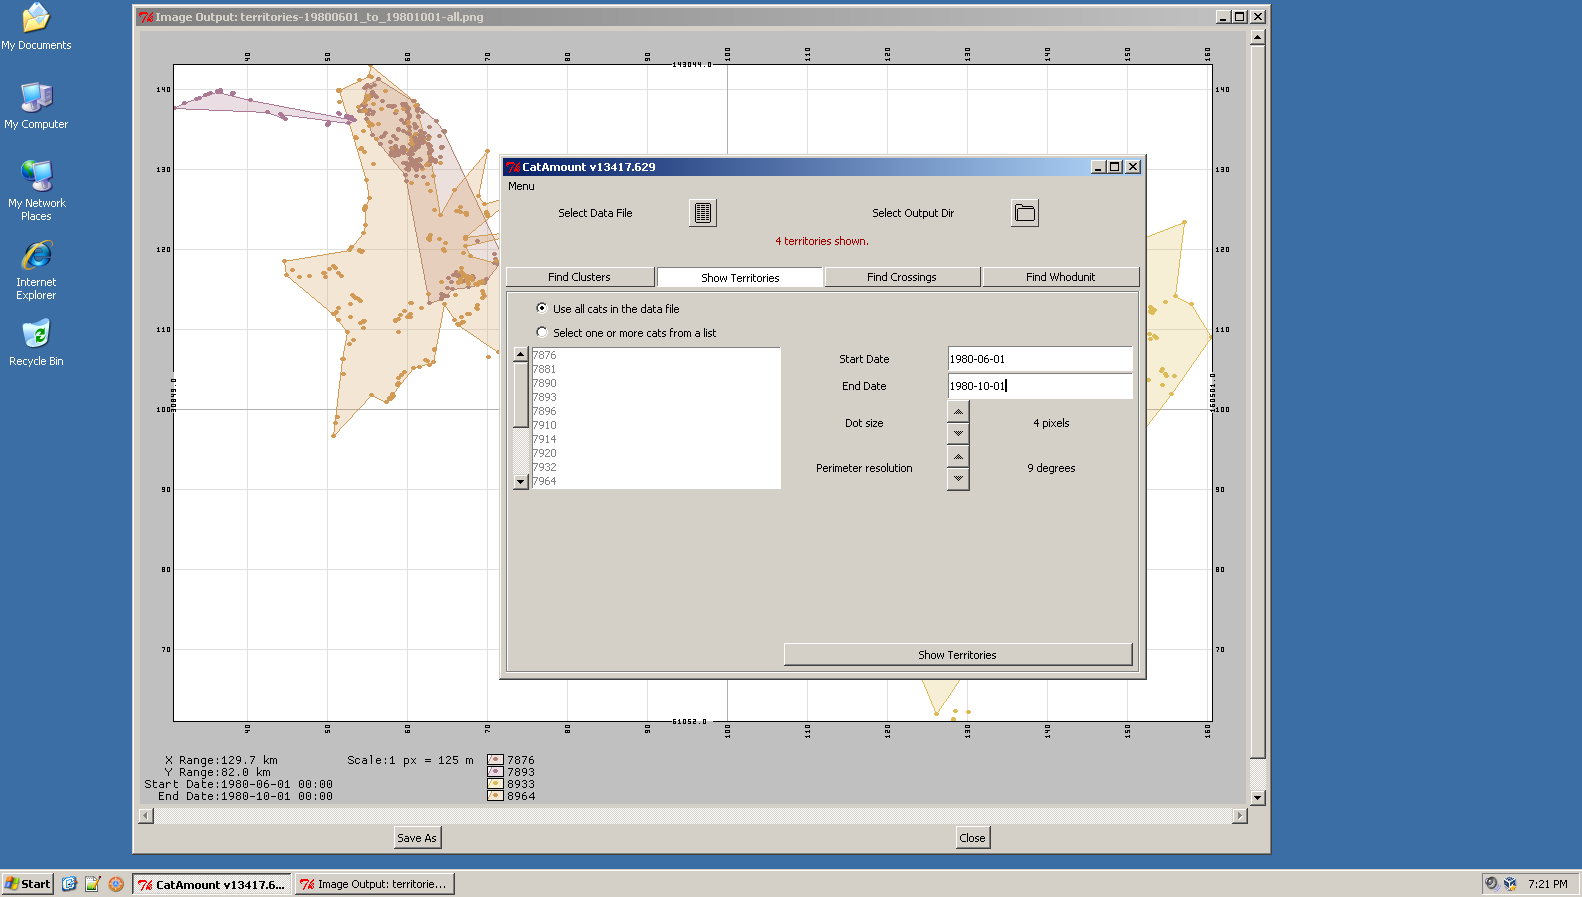
Screenshot of Show Territories in action.
Click to enlarge