STOPLOOK
2012-06-13
STOPLOOK is a command line application that generates completely custom timeline graphics. Each graphic shows how your day is going, where your time is being spent, as well as sun and moon position, moon phase, and purchases.
The software is called STOPLOOK because it lets you look at your time data. It also happens to be eight characters long, like many of my code projects.
Here is how you would typically use the software to create a single timeline for a given day:
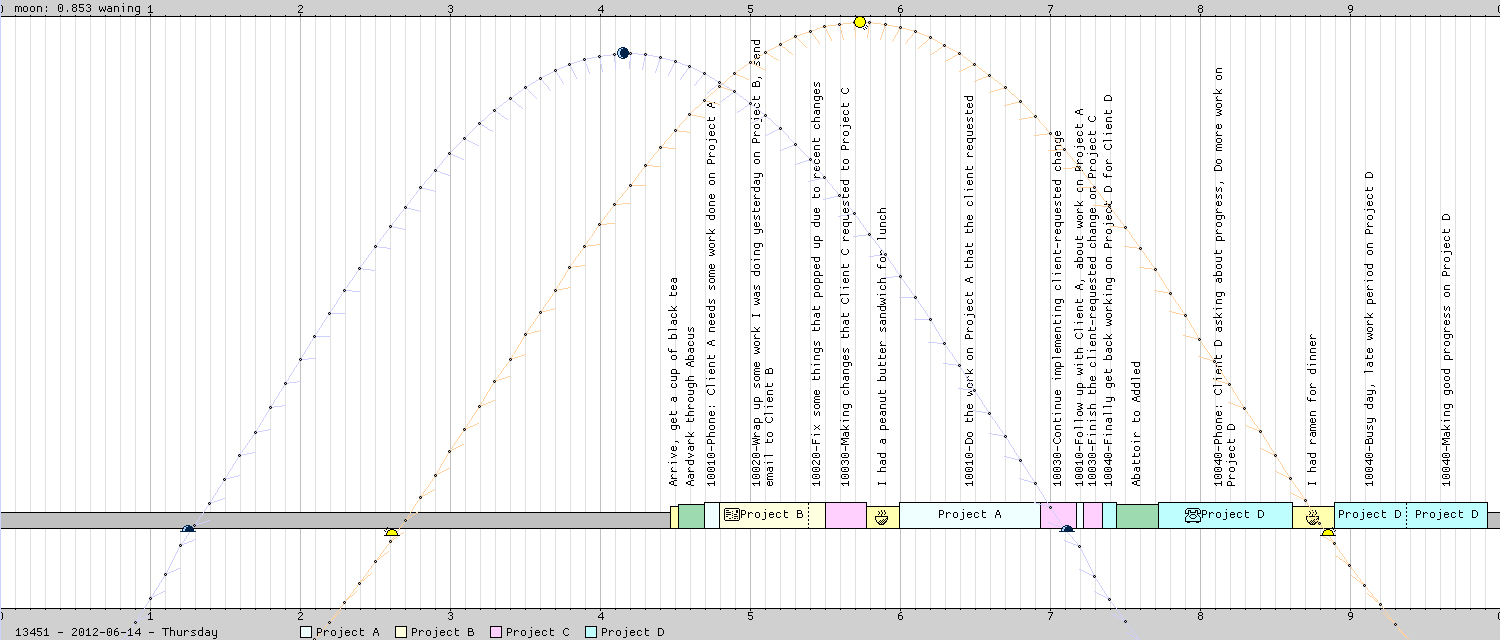
With our sample data, this would return a timeline graphic like this:
The graphic shows, visually, how much time was spent on each project. It also shows sun position and direction throughout the day, moon position and direction throughout the day, and moon phase. It shows moon rise, moon set, sun rise, sun set. Moon phase is also written at the top left. This date is close to the summer solstice, so the sun is scraping the top of the graphic.
What I like best about the timeline graphic is that you can theoretically string them end to end, resulting in an incredibly long ribbon graphic that represents your life. Or you can stack them on top of each other vertically to observe patterns in the ways the bars of color shift back and forth through the seasons.
Options, Arguments
There is a full command-line program that generates the graphics, with a number of arguments. You can specify the day you want to see, which database to interpret, and where to put the file. The result of running the script is to create an image graphic on the file system, which can then be viewed with other tools.
The help information of the command gives an idea about what this application can do:
Integration With GUI
The STOPTHAT GUI can use STOPLOOK and TIMEVIEW to summon a timeline graphic for the current day, or yesterday. I am always checking the timeline to see what my day is looking like, and where I'm spending my time.
 kasploosh.com
