 kasploosh.com
CatAmount
2012-06-12
CatAmount User Guide
CatAmount is custom software that I wrote that analyzes GPS wildlife collar data and identifies patterns that are useful to wildlife researchers. It identifies clusters, crossings, and “whodunit” which is like the inverse of a cluster.
This application is free software, written in cross platform Python 3. It has a GUI front end to make it easy to use. It reads in GPS collar data in CSV format. It produces answers in text format, and also creates image feedback of the answers. I wrote a User Guide for the software.
The software was originally written for mountain lions, and later used for snow leopards. But the software is flexible, with complete control over how a cluster/crossing is defined, so it could be used for any type of GPS data where you hope to find clusters or crossings.
I donated my time on this project in the hope that this donation of time and software would benefit the animals being studied.

Important Links
- View the code on GitHub
- Download and read the User Guide
- CatAmount software was used in the study of mountain lions in the western USA (2012)
- CatAmount software was used in the study of snow leopards in Mongolia (2019)
A Bit Of Story
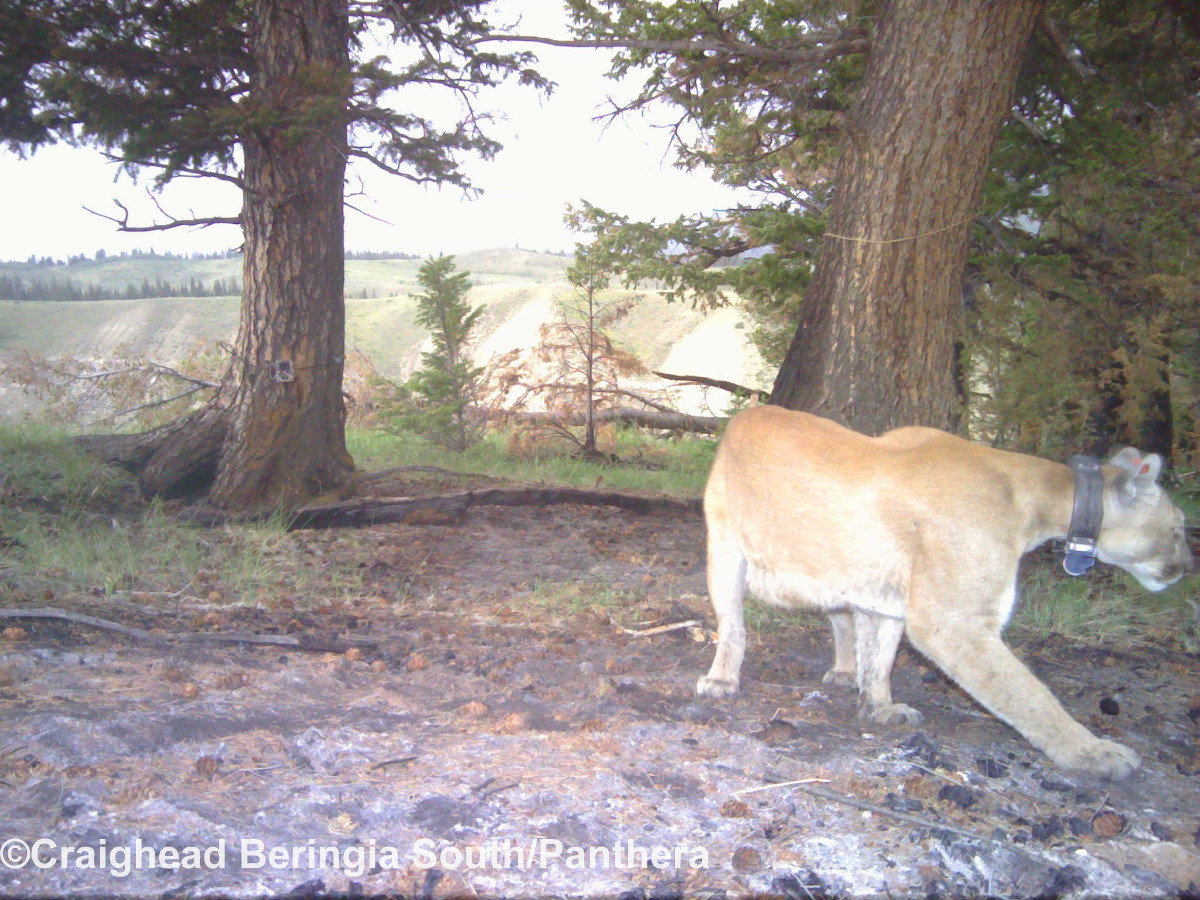
Example collar
Click to enlarge
Researchers want to know more about a wildlife species so they sit around a table and talk about how to do that. You can’t exactly follow a wild animal around with a notebook, they will scratch you or run away.
Along came GPS collars to track the locations of wild animals when they are doing their normal routine. You get a record of where that animal has been.
By looking at the location data of the animal, you might find that it spends a longer amount of time in one location. Rather than moving through the landscape it has stopped somewhere for a while. This could be to meet up with another animal, to hide some food, to share some food, to recover from illness.
You can use CatAmount software to search through GPS data and identify clusters, which are locations where an animal spent a significant amount of time. Then researchers can possibly travel to that point and examine the site. For example, visit a cluster location to look for the carcass of the prey animal that was eaten there.
Another interesting pattern that can be found is a crossing. A crossing is like a cluster that involves more than one animal. If you have several GPS collars deployed, crossings indicate when one animal met up with another animal for a significant amount of time. What were they doing together?
CatAmount software has another ability to find whodunit. If you find a prey site in the real world, you can record the exact location and approximate time. Then you can search through all your GPS collar data and see if any collared animal was in that location at that time.
The last feature of CatAmount software is show territories. Animals like mountain lions are known to establish a territory. Show territories takes the GPS data and makes a polygon of where each animal was located. This is useful only as visual feedback and sanity check on the input GPS data.
Read more detail about each function of the software using the navigation below.